eu energy outlook to 2060: power prices and revenues predicted for wind, solar, gas, hydrogen more
to give an idea of how the energy market may develop in the future, energy brainpool’s “eu energy outlook 2060” illustrates commodity prices, power plant expansion and electricity demand, and shows the wholesale power prices resulting from these factors up to 2060.
the “eu energy outlook 2060” explains and compares the developments in energy brainpool’s “central” and “gohydrogen” power price scenarios for the eu 27, including norway, switzerland and the uk. however, the actual developments in the individual countries may vary significantly. detailed modelling of the individual national markets and the country-specific influencing factors, including sensitivity analysis, is essential in order to be able to make well-founded decisions.
energy brainpool’s power price scenarios
energy brainpool currently offers three power price scenarios. figure 1 shows the different trends in the scenarios. the fluctuations relate to the assumptions regarding the development of commodity prices, the power plant fleet and the flexible demand for electricity. for the current update, it should be emphasised that the new world energy outlook 2023 with the three commodity price scenarios “stated policy”, “announced pledges” and “net zero emissions” was published by the international energy agency, which we use as a source for the long-term commodity price assumptions of our power price scenarios.
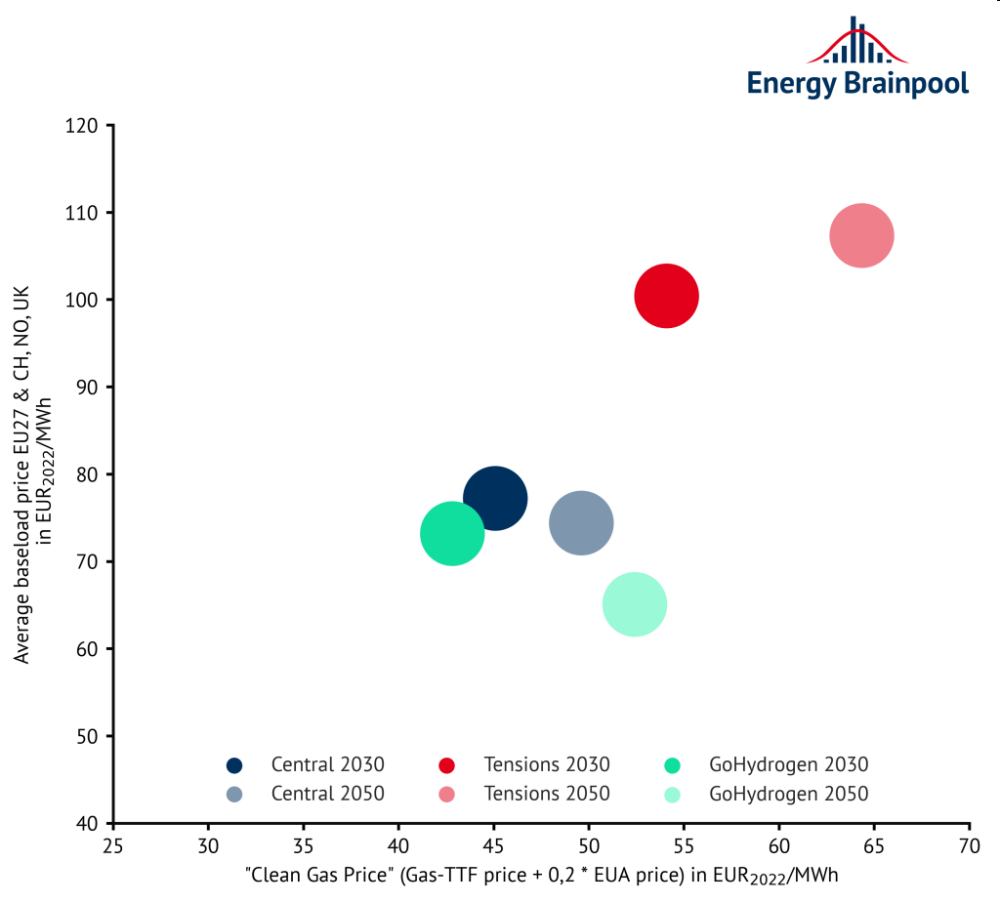
figure 1: trends in the different scenarios
the “central” scenario
in the “central” scenario, it is assumed that europe will completely stop importing russian pipeline gas by 2027 at the latest as a result of the current tensions with russia. the price of natural gas in europe will then be based on the global market price for lng. in the long term, fossil natural gas will be replaced by the use of synthetic fuels and, in particular, “green” hydrogen. insofar as natural gas is still used for power generation after 2040, its price will have to fall in order to remain competitive as the price of co2 rises.
the scenario assumes a highly decentralised energy system in the future with a significant expansion of renewables in order to reduce the general import dependency on fossil fuels in the medium term and end it as quickly as possible. this goes hand in hand with an increase in flexible power demand: in addition to the increasing production of hydrogen by electrolysers, the heating sector will be completely decarbonised by 2060 through a further expansion of heat pumps. by the year 2060, the proportion of electric mobility in europe, encompassing both cars and trucks, is anticipated to surge to 95 percent.
the “tensions” scenario
the “tensions” scenario assumes that the current tensions between russia and the west will continue and intensify in the coming years. as a result, europe will stop importing russian pipeline gas as early as possible. the price of natural gas is then based on the global market price for lng. european consumers are competing for lng with the asian markets, which will also lead to a high natural gas price level in the medium term.
at the same time, there is an increase in co2 prices compared to the “central” scenario. this should generate additional revenue to refinance government debt and promote technological development in the use of hydrogen. in individual countries, such as germany, the expansion of renewables is progressing more slowly than in the “central” scenario due to a shortage of skilled labour and insufficient political support, among other things.
the “gohydrogen” scenario: a hydrogen energy world
with the eu green deal, for the first time there is a clear target at the european level for achieving europe-wide climate neutrality by 2050. while the goal is given, the ways to achieve it are still unclear. with “gohydrogen”, we have developed a scenario for how the major transformation of the energy system can be organised against this backdrop.
the “gohydrogen” scenario describes a future energy supply for europe in which fossil natural gas is replaced by hydrogen in the long term. the utilisation potential of hydrogen is fully exploited in the main energy sectors, so that hydrogen becomes one of the main energy sources. fuel cell trucks, climate-neutral steel from the direct reduction process, feedstock use in the chemical industry and hydrogen-based heating systems are applications in which hydrogen technologies will play a key role. in 2050, this will result in a europe-wide hydrogen demand of over 2,200 twhgcv, 50% of which can be covered by domestic (european) hydrogen production (mainly by electrolysers).
an electrification rate is also assumed for certain applications such as private transport, provision of industrial process heat and heat supply in the building sector, so that the total power demand, including the power consumption of electrolysers, will increase significantly. an annual europe-wide electricity demand of over 5,700 twh is assumed by 2050, which is almost double today’s power consumption. this increase in power demand will be offset primarily by the strong expansion of renewable generation plants such as onshore and offshore wind power plants and solar power plants, but also by the expansion of “h2-ready” gas turbines.
in terms of hydrogen imports, regions such as mena, sub-saharan africa, australia and south and north america offer great export potential. the mena countries are in a key position due to convertible natural gas pipelines and their geographical proximity to europe. further information on the “gohydrogen” scenario can be found in our white paper, which you can download free of charge from our website.
the development of commodity prices: fuels, co2
in the short term, the current developments on the futures markets are taken into account for fuel and co2 prices. compared to the record highs in mid-2022, natural gas prices in particular have fallen significantly again in recent months. compared to their long-term average, however, they remain at a high level. figure 2 shows an example of the development of the futures price for natural gas (ttf) for the delivery year 2024. for the coming years, the futures market expects a further decline in gas and hard coal prices, while co2 prices (eua and uka) are expected to rise slightly.
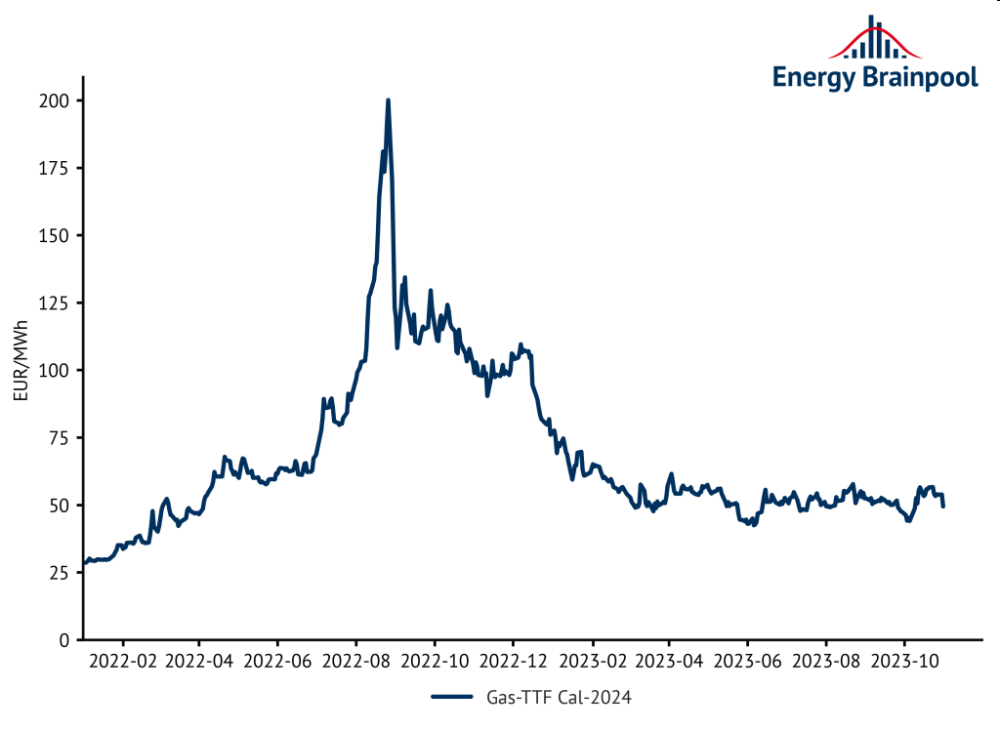
figure 2: future gas ttf prices / source: ice, 2023
for natural gas, it is assumed in the power price scenarios that the european natural gas price will be based on the global market price for lng in the medium term. as the most important import source for europe, us lng can be assumed to set the price. the export price for us lng historically corresponds to the us benchmark price for natural gas at the henry hub trading centre. in addition, there is a demand-driven surcharge for transport within the usa and a fee for the liquefaction of natural gas for transport as lng.
in order to estimate the price for us lng on the european market, costs for freight and regasification in europe must also be taken into account. figure 3 shows the composition of the cost components based on the henry hub “price forward curve” as well as the average assumptions for liquefaction, freight and regasification costs. considering the exchange rate and inflation assumptions, the natural gas price for our “central” scenario is 22.30 eur2022/mwh. this price is used in the scenario as an assumption for the year 2030.
compared to the iea’s current world energy outlook 2023 (iea, 2023) [1], it is around 3 eur /mwh higher than the value assumed in the “announced pledges scenario” (aps) for the natural gas price in europe for 2030. in the aps, only the emission reductions to which governments have already committed themselves in the form of pledges are realised. this is in line with the basic assumption of our “central” reference scenario that the legally defined targets for the expansion of renewables and emission reductions are adopted as assumptions.
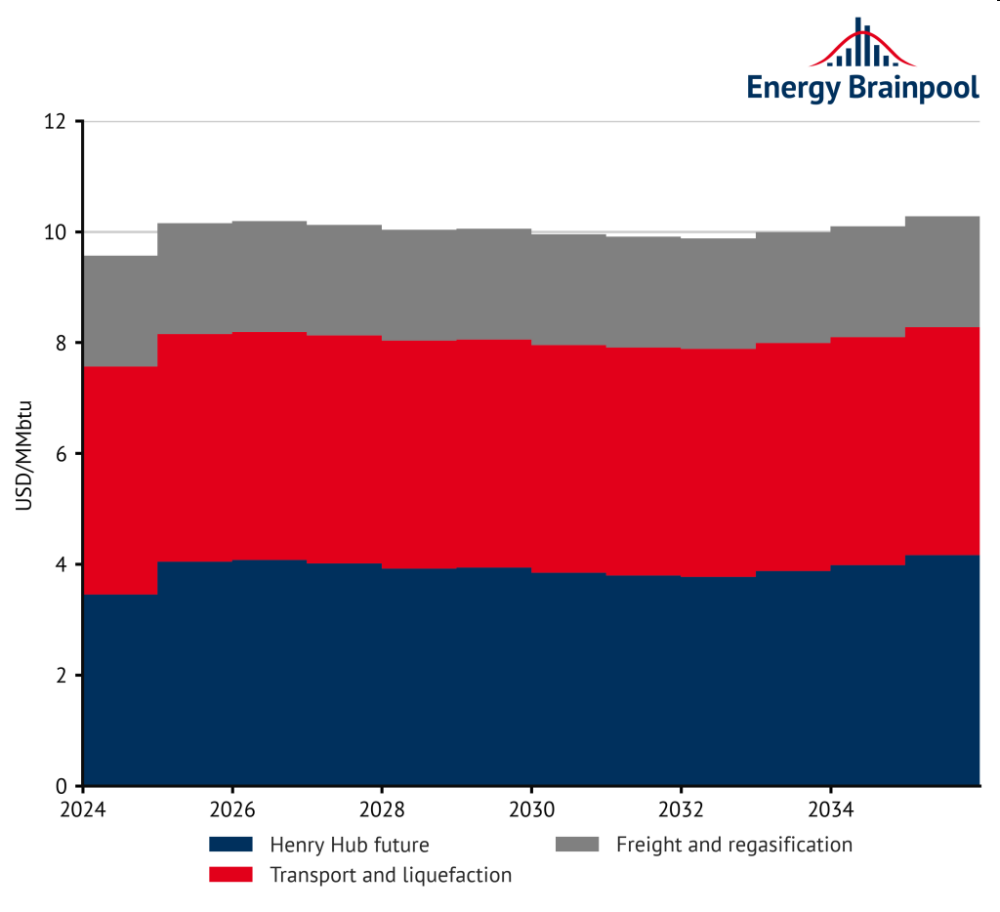
figure 3: cost components on the global lng market / source: us office of fossil energy and carbon management, 2023
the procedure is similar for the “tensions” and “gohydrogen” scenarios, except that the maximum and minimum instead of average mark-ups for transport and liquefaction on the current future price for american natural gas are applied over the last four years.
figure 4 shows the resulting scenario points for the natural gas price in 2030 and 2050. for comparison, the assumptions from the scenarios of the world energy outlook 2023 – in addition to aps, the “stated policies scenario” (steps) and the “net zero emissions by 2050” (nze) – are compared. in all three power price scenarios, a higher natural gas price is assumed for 2030 than by the iea; specifically, the average, minimum or maximum level of the forecast lng world market price is assumed for 2030 for the three scenarios. over time, the price assumptions in the “central” and “gohydrogen” scenarios tend to follow the “announced pledges” scenario until 2040. in the “tensions” scenario, on the other hand, the natural gas price remains at a constant level until 2040.
in the long term, fossil natural gas will be replaced by hydrogen in its end applications. specifically, this will either be produced from electricity using electrolysis or imported from non-european regions such as mena, the americas and oceania. we assume that such “green” hydrogen will be traded on the global market and will compete with the “clean gas price” from 2040 at the latest. the “clean gas price” is made up of the price of natural gas or comparable gaseous fuels plus the eua price, multiplied by the natural gas emission factor of 0.2 tco2/mwhth. this increases the price pressure on natural gas after 2040, with hydrogen gradually replacing natural gas.
as a result, the natural gas price in the “tensions” scenario approaches the price level in the “stated policies” scenario by 2050, and the natural gas price in the “central” scenario comes close to the level in the “announced pledges” scenario. the “gohydrogen” scenario assumes a significantly higher supply of hydrogen on the global market and therefore a lower price level than in the other two scenarios. as a result, the price of gaseous fuels falls below the level of the “net zero emissions” scenario in the weo in the long term after 2040.
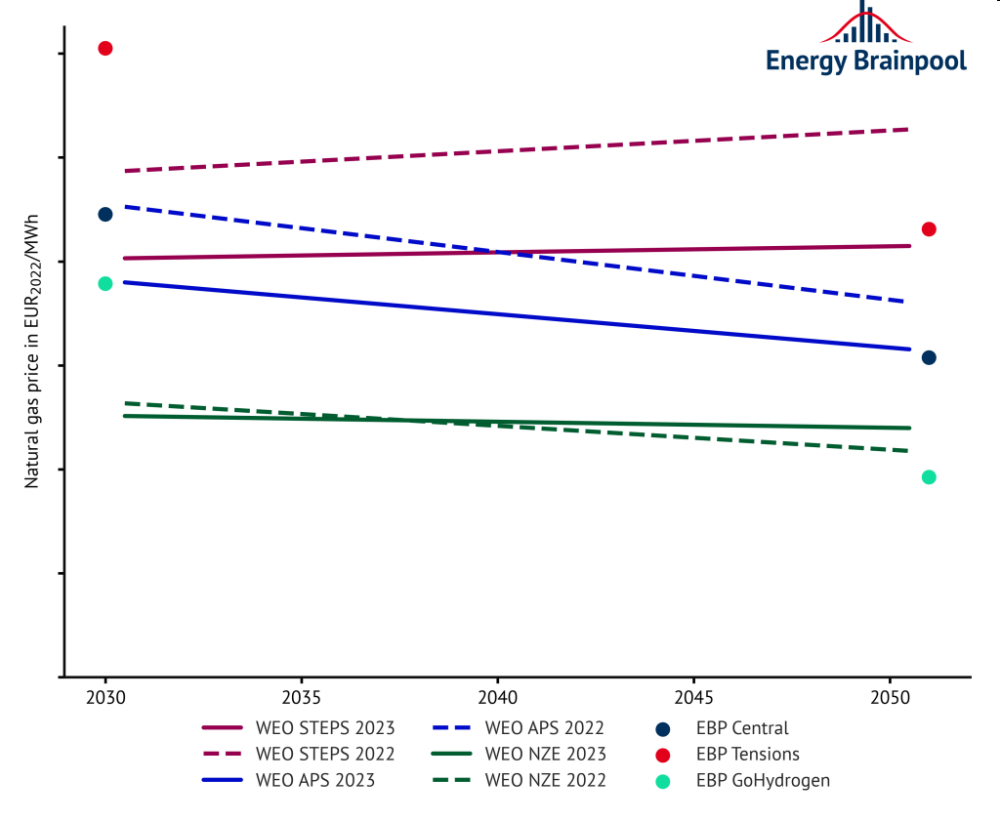
figure 4: natural gas price in the world energy outlook and in the ebp power price scenarios / source: iea world energy outlook, 2023
the development of medium and long-term commodity prices for hard coal, crude oil and co2 certificates from 2030 to 2060 is based on the assumptions of the current world energy outlook. these are shown for hard coal and euas in figures 5 and 6. for coal, the weo assumes higher prices than last year in all scenarios, which is due to declines in supply as a result of the russian invasion of ukraine and continued high demand, particularly in india and china. there are no changes in co2 prices for the “announced-pledges” and “net-zero-emissions” scenarios. over time, the price of coal falls in all three scenarios until 2050, while the price of co2 rises continuously.
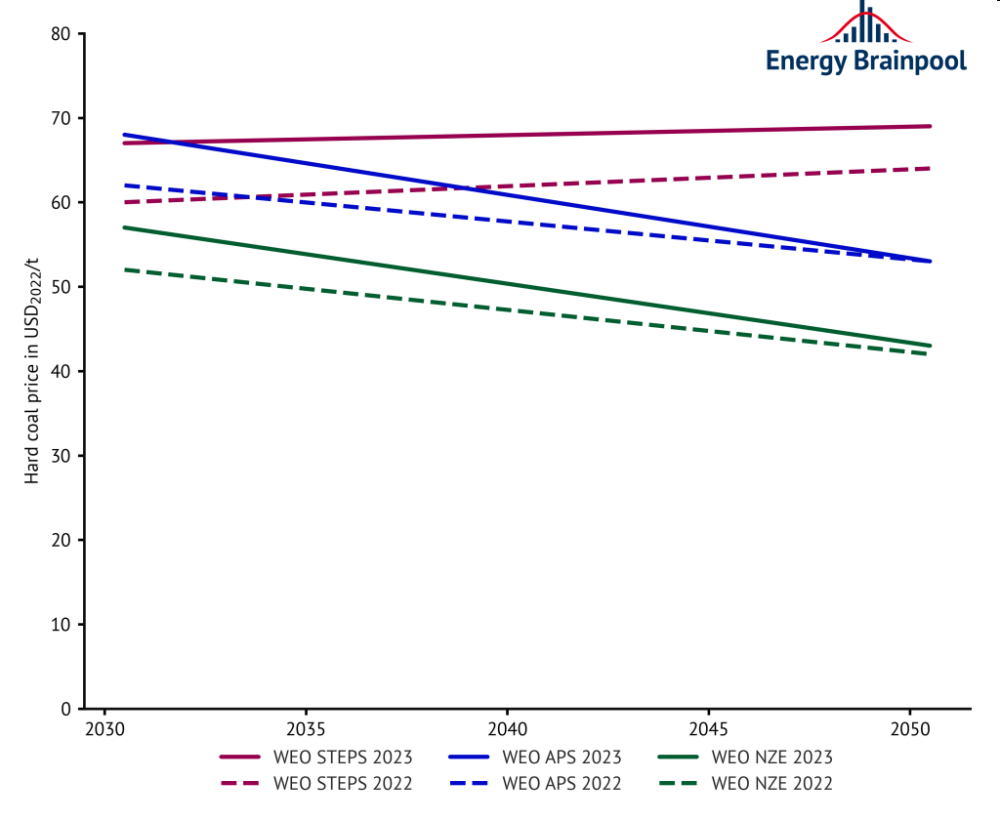
figure 5: hard coal price in the world energy outlook / source: iea world energy outlook, 2023
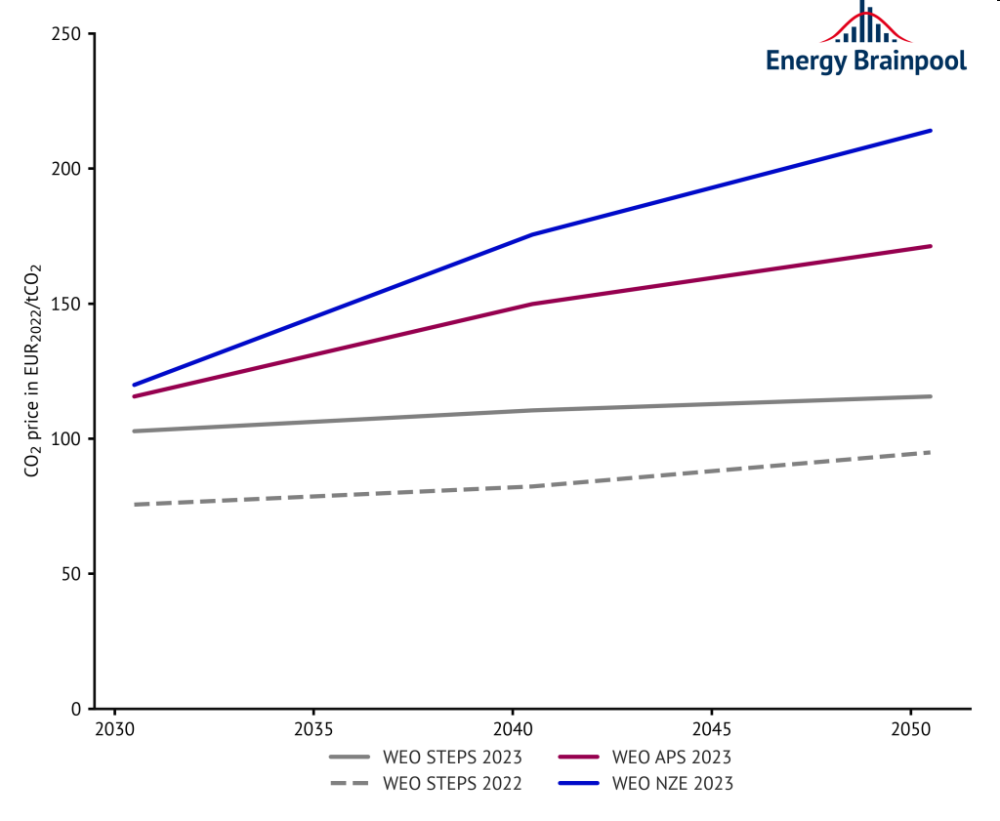
figure 6: co2 price in the world energy outlook / source: iea world energy outlook, 2023
what will the european power plant fleet of the future look like?
in the past, the power plant fleet in europe was particularly dominated by fossil-fuelled generation capacities. many of the power plants on the market have already reached an advanced age and will have to be replaced by 2050. only those power plants that are already in the construction process are exempt from this.
the results of european climate policy are also taken into account in the development of the european power plant fleet. almost all eu countries that still generate electricity from coal have now decided to phase out coal in order to limit the negative effects of high co2 emissions. established and proven technologies are available for the future: gas-fired power plants, renewable energies and, in some markets, nuclear power plants.
wind power and photovoltaics in particular continue to have great growth potential. these technologies are now competitive thanks to the sharp fall in costs. this is also evident from the increasing number of ppa-based projects, particularly for solar power plants. however, due to the strong expansion up to the middle of the century, renewables are coming under increasing economic pressure due to the cannibalisation effect of the plants.
in the “central” scenario, the share of these “variable renewable energy sources” (vres) increases to around 77 percent of the total supply by 2050 (see figure 7). consequently, their often simultaneous electricity generation is lowering the hourly power price more often and to a higher degree. all renewable technologies (excluding hydrogen-powered gas turbines) together account for 86 percent of the power plant fleet.
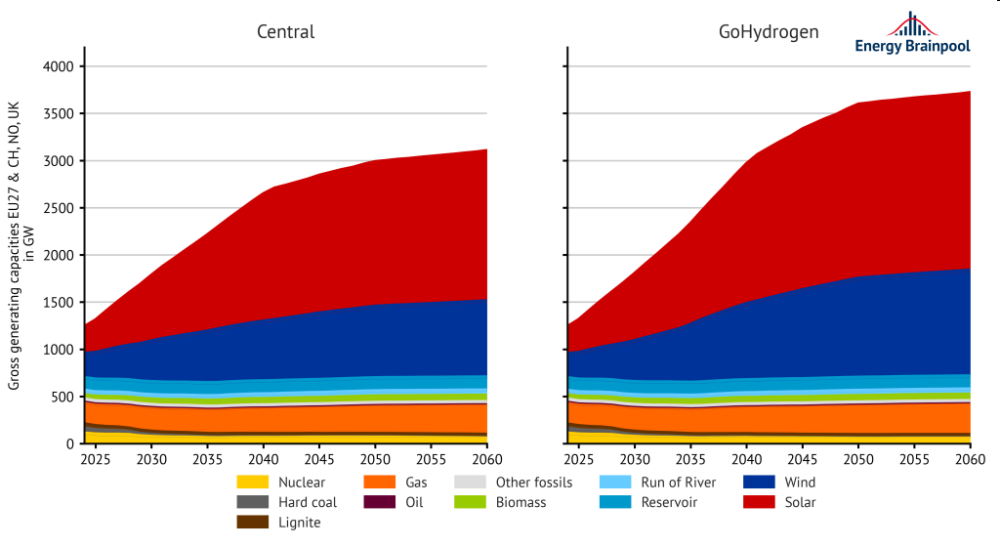
figure 7: installed generation capacities by energy source in the “central” and “gohydrogen” scenarios in the eu 27, plus no, ch and uk
in terms of dispatchable fossil generation capacity, gas-fired power plants will be the main source of additional capacity at the european level in future. they have lower emissions compared to coal-fired power plants. the latter will continue to lose importance even with carbon capture and storage (ccs). at the same time, modern “h2-capable” gas turbine power plants can also burn hydrogen and other synthetic gaseous fuels instead of fossil natural gas. as a result of this change, gas turbines and combined cycle power plants will no longer be considered fossil-fuelled power generators in the long term, but will at least partially be counted as “emission-free” power plants. it can therefore be assumed that gas-fired power plants will remain an important technology for power generation in the long term. with gas and nuclear power plants, the share of emission-free generation capacity will increase to 99 percent in 2050.
the capacities of coal-fired power plants will decrease by more than 82 percent by 2050 and by almost 93 percent by 2060. in the case of nuclear power, the current installed capacity will decrease by around 19 percent by 2050 following the shutdown of german power plants. overall, the share of generation capacity of dispatchable thermal power plants (including gas) is reduced from currently around 40 percent to around 14 percent by 2050. this has a significant impact on the structure of power prices, which are increasingly characterised by vres.
in the “gohydrogen” scenario, an increased expansion of renewable plants is expected, so that the installed generation capacities in europe will be well over 3,500 gw by 2060. solar and wind power plants in particular will be expanded to a greater extent than in the “central” scenario, meaning that they will account for over 80 percent of total generation capacity by 2050.
modern, “h2-capable” gas turbine power plants, which burn hydrogen and other synthetic gaseous fuels in addition to fossil natural gas, also remain relevant here. these are therefore no longer necessarily considered fossil-fuelled power generators, but are at least partially counted as “emission-free” power plants. this means that practically all generation capacities in this scenario will be emission-free by 2050.
in the “gohydrogen” scenario, nuclear and coal-fired power plants are decommissioned along the same trajectory as in the “central” scenario. due to the strong expansion of renewable power plants, the share of generation capacity of dispatchable thermal power plants (including gas) in the “gohydrogen” scenario is reduced from currently around 40 percent to around 12 percent by 2050. as a result, power prices in this scenario are characterised even more strongly by vres than in the “central” scenario.
rising electricity demand and changes in electricity generation by 2060
in the “central” scenario, total electricity demand increases by around 64 percent by 2050 and by around 71 percent by 2060, as shown in figure 8. electricity demand increases primarily due to
- the national hydrogen strategies and the expansion of hydrogen applications (spread of fuel cell technology in the transport sector and increased use of hydrogen in steel production and in the chemical industry),
- the increased electrification of various energy services in households (in particular through the spread of heat pumps and other electrical heating applications for the provision of hot water and space heating),
- and the rise in electromobility.
according to the european commission’s plans, the majority of economic growth will take place in the tertiary sector, which also requires more electricity. in the industrial sector, higher efficiency can prevent a significant increase in electricity consumption.
under the “gohydrogen” scenario, a greater share of residential and transportation applications will undergo electrification compared to the “central” scenario. this shift will lead to an increased need for electricity. moreover, hydrogen usage in industry and transportation will see a further uptick, necessitating more electrolysers. consequently, this amplifies the demand for electricity, especially in terms of flexibility. overall, the demand for electricity in the “gohydrogen” scenario will therefore exceed that of the “central” scenario by around 1,000 gw in 2050.
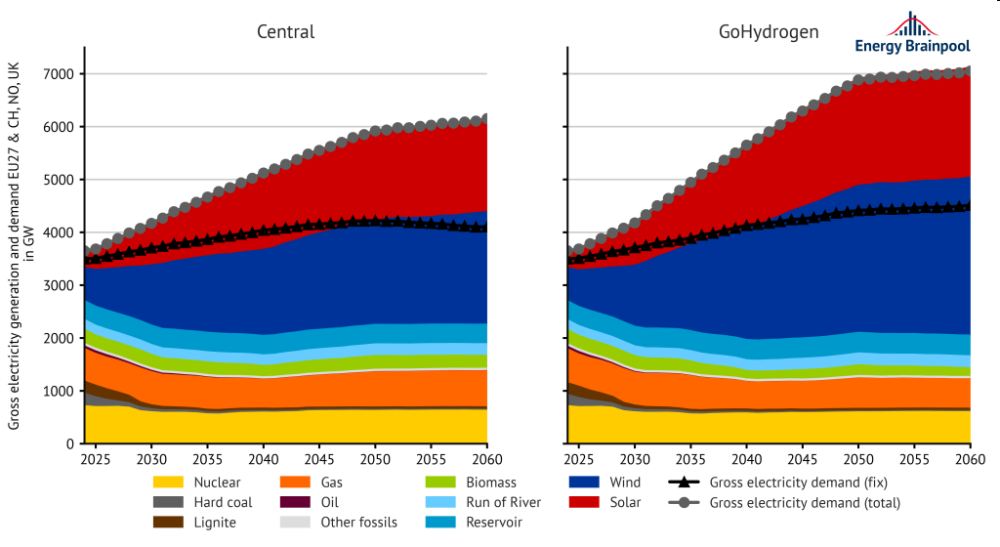
figure 8: gross electricity generation and demand by energy source in the “central” and “gohydrogen” scenarios in the eu 27, plus no, ch and uk
the amount of power produced from coal-fired power plants declines sharply for both scenarios. it decreases by around 73 percent by 2030 and by around 92 percent (central) and 95 percent (gohydrogen) by 2050. however, power production from gas-fired power plants remains almost constant until 2050.
in the “central” scenario, the share of renewable energies in electricity generation in 2050 is over 76 percent. wind and solar power plants account for the largest share at around 62 percent. these shares are even higher in the “gohydrogen” scenario, where 82 percent of electricity will be provided by renewable plants in 2050, 70 percent of which will come from wind and solar plants. the remaining electricity will be produced by dispatchable renewable energies, such as biomass power plants or storage reservoirs.
a further 18 percent of the power generated in the “central” scenario is also produced emission-free, either in nuclear power plants (11 percent) or in gas-fired power plants through the combustion of green hydrogen (7 percent). in this scenario, the share of emission-free generation in 2050 is therefore over 94 percent. although nuclear power plants provide the same amount of power in absolute terms in the “gohydrogen” scenario as in the “central” scenario, they account for a lower percentage of power generation due to the higher total generation capacity. in the case of gas turbines, the share of emission-free production from hydrogen differs between the scenarios. in the “gohydrogen” scenario, for example, a share of almost 100 percent of power generated without emissions can be observed in 2050.
development of average power prices
what factors will affect the development of the baseload price – i.e. the unweighted average price for power on the day-ahead spot market over all hours of a year – in the years 2023 to 2050? commodity and co2 prices as well as the expansion of renewable energies and the development of power demand are particularly relevant. the development of average power prices in the various scenarios is shown in figure 9.
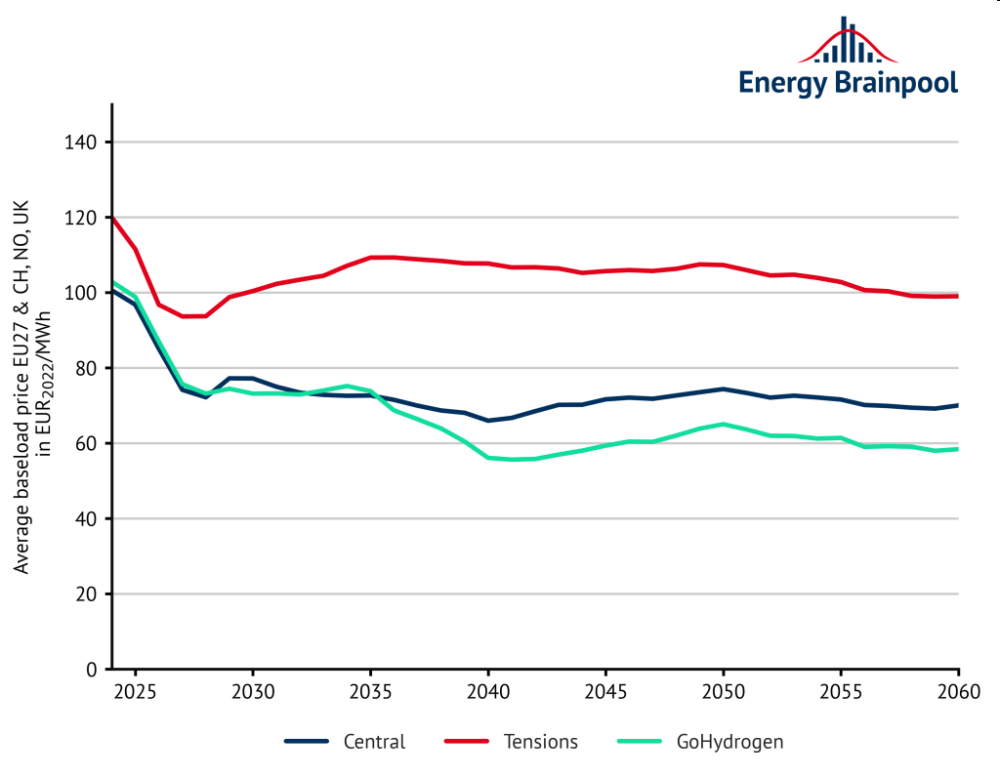
figure 9: development of power prices in the respective scenarios
over the next few years, power prices will be characterised by the currently still high price level on the futures markets, although these have already begun to relax. in addition, prices will be depressed by the ever-increasing feed-in from wind and photovoltaic power plants. as a result, there are increasingly more hours with low and – in countries with subsidy systems for renewable energies or noteable “must run” capacities – often negative power prices. as a result, real power prices in the “central” scenario decrease only slightly between 2030 and 2060, with a more significant decrease and a subsequent increase around 2040.
the “gohydrogen” scenario, on the other hand, shows a more significant decrease in power prices from 2035, after which the price stabilises at a permanently lower level than in the “central” scenario, with certain fluctuations until 2060. in this scenario, higher feed-ins from wind and solar power plants are observed, leading to more hours with low and negative prices than in the “central” scenario.
compared to the last edition of the eu energy outlook from april 2023, the average power prices between 2030 and 2050 have fallen slightly for both scenarios due to the increased expansion of wind and photovoltaic (pv) systems in some countries.
large deviations are visible between the individual european countries. this is shown by the fluctuation ranges shown in figure 10. due to the development of commodity prices, countries with a low expansion of renewable energies in particular see a stronger increase in power prices.
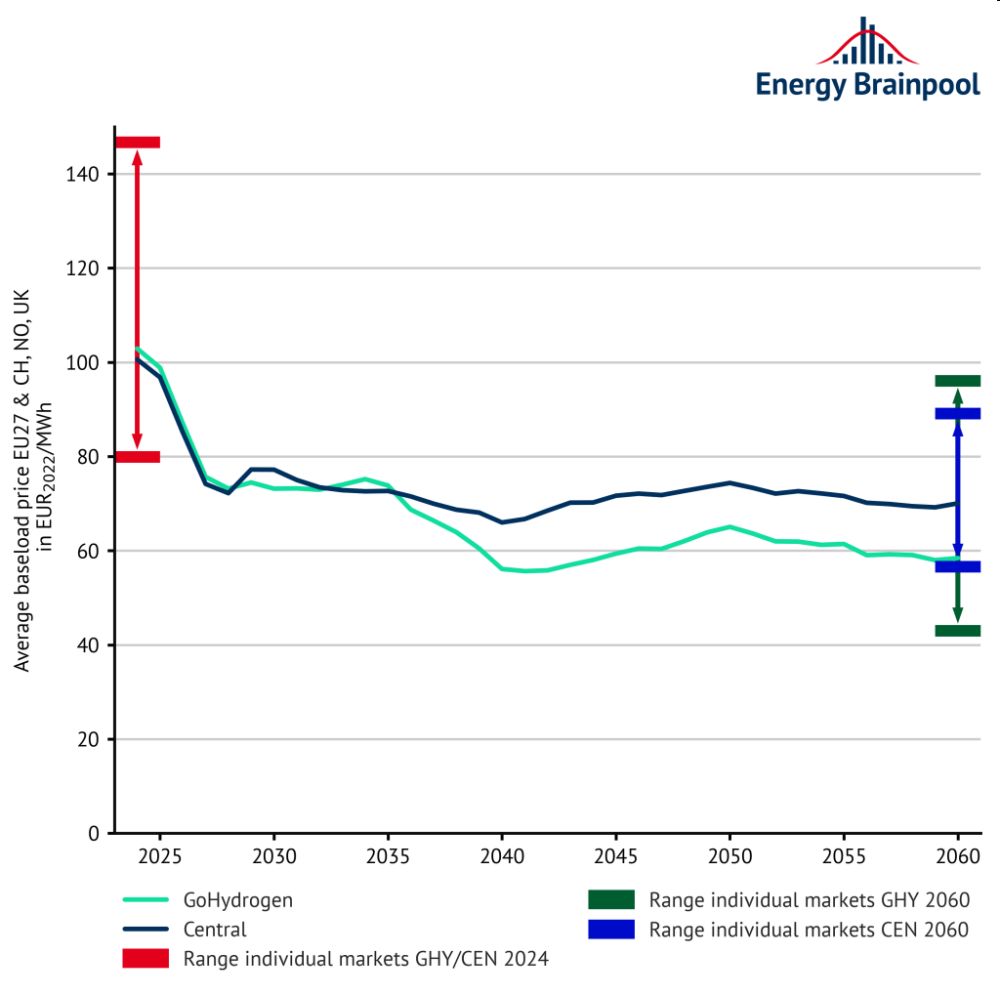
figure 10: average annual baseload prices and fluctuation range of individual national markets in selected countries in europe
if we look at power prices on a monthly basis, it becomes clear that the power market is subject to seasonal fluctuations (see figure 11). the analyses show rising prices in winter due to the temperature sensitivity of power demand. power prices in summer are usually significantly lower. this effect is reinforced by the increasing share of solar power generation, so that the seasonal price differences will increase in the future. this effect is even more pronounced in the “gohydrogen” scenario, as solar power generation is expanded on a larger scale. in addition, the increased use of heat pumps in winter will result in higher demand, which will lead to greater seasonality than in the “central” scenario.
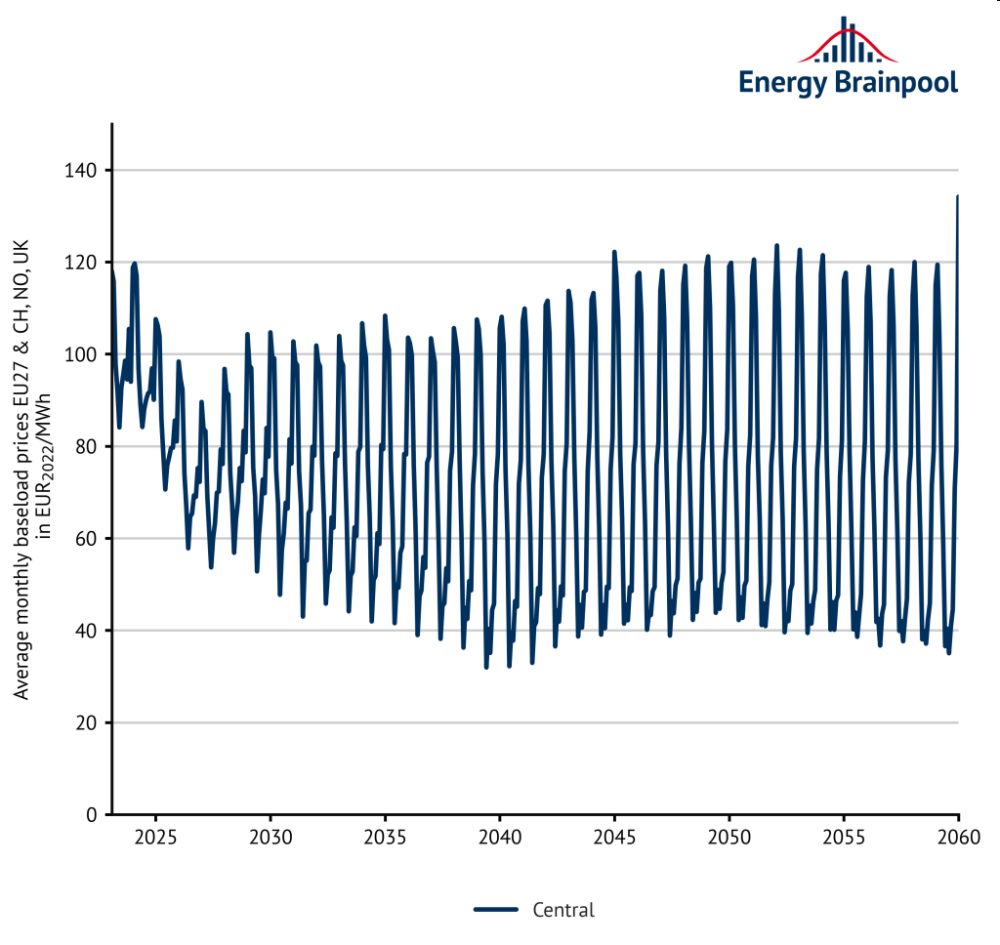
figure 11: average monthly baseload prices
what revenues can wind power plants achieve?
the sales value is the average volume-weighted power price that wind and pv plants can achieve on the spot market over the course of the year. only generation hours with positive power prices are taken into account in the calculation (including 0 eur/mwh). by contrast, the sales volume indicates the share of the electricity quantities generated in these hours in the total generation quantity.
the product of the sales value and the sales volume is the capture price. in contrast to the sales value, the capture price is the average annual revenue on the electricity market for the entire generation quantity. this also applies in hours with negative power prices. these key figures make it possible to realistically assess the revenue potential of fluctuating, renewable energies on the electricity market. (see white paper “assessment of electricity market revenues of fluctuating renewable energy plants“ )
as figure 12 shows, the capture prices for wind turbines will fall noticeably from 2025 onwards. the reason for this is increasing capacities. parallel generation by a higher number of plants reduces power prices in these hours (cannibalisation effect). this decline continues more slowly for the “central” scenario until 2040, until there is a moderate increase again from 2040 due to the increasing flexible demand for power. in the “gohydrogen” scenario, on the other hand, a sharper decline can be observed between 2035 and 2040, before capture prices stabilise with slight fluctuations from 2040 onwards. this results in lower prices overall because capacities grow more than in the “central” scenario due to the increased expansion of renewable plants.
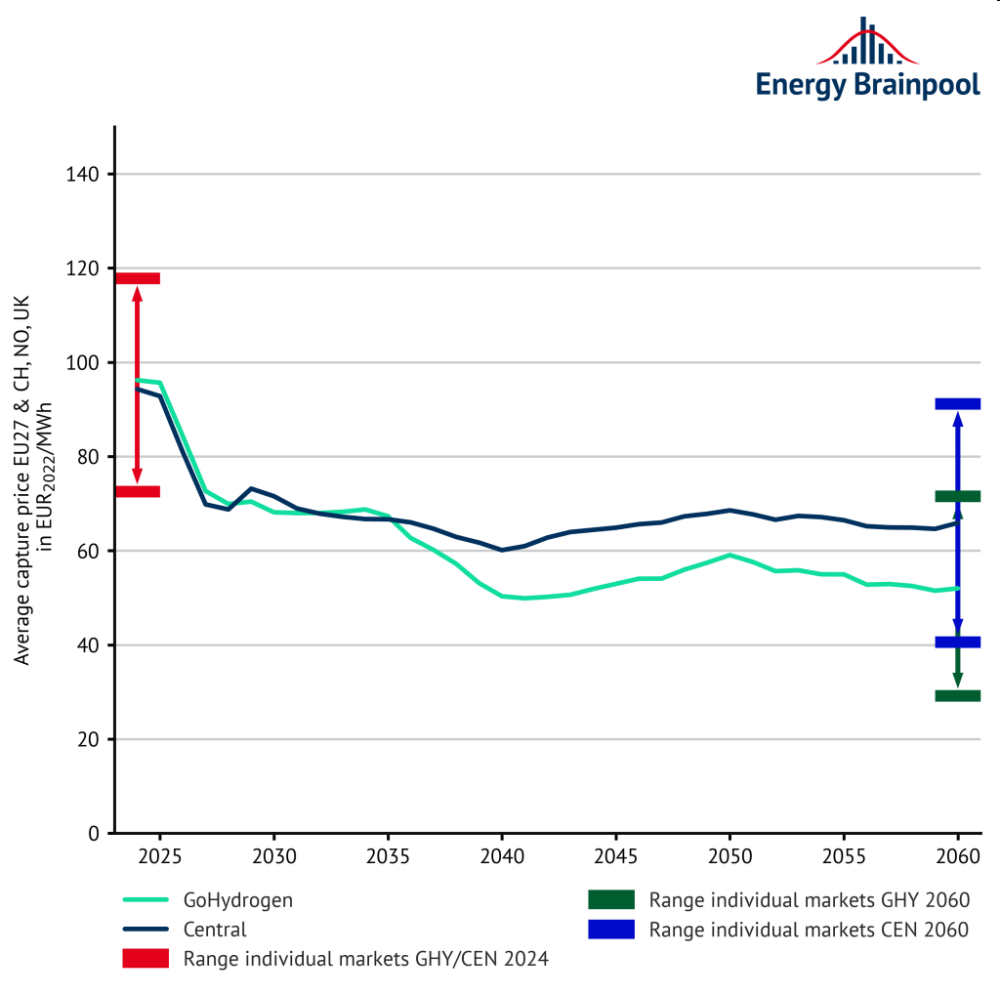
figure 12: average capture prices for wind in selected european countries
the many hours in which dispatchable fossil-fuelled power plants set the price, despite the high proportion of renewable energies, enable positive revenue streams. the fluctuation range of the markets shows how different the country-specific average revenue opportunities for wind turbines in europe are.
what revenues can photovoltaic systems (solar) achieve?
the average sales and capture price of photovoltaic systems fall more sharply compared to wind in both the “central” and “gohydrogen” scenarios (see figure 13). the reason for this is the significant expansion of photovoltaic capacity, including in germany, in conjunction with the pronounced cannibalisation effect of pv. in hours when a lot of solar power is generated – particularly during the daytime hours in summer – power prices and therefore revenues fall. in the “gohydrogen” scenario, lower capture prices for solar installations from 2035 than in the “central” scenario are observed because the increased capacities in the wind power plants ensure generally lower power prices, which also influence the revenues from photovoltaic installations.
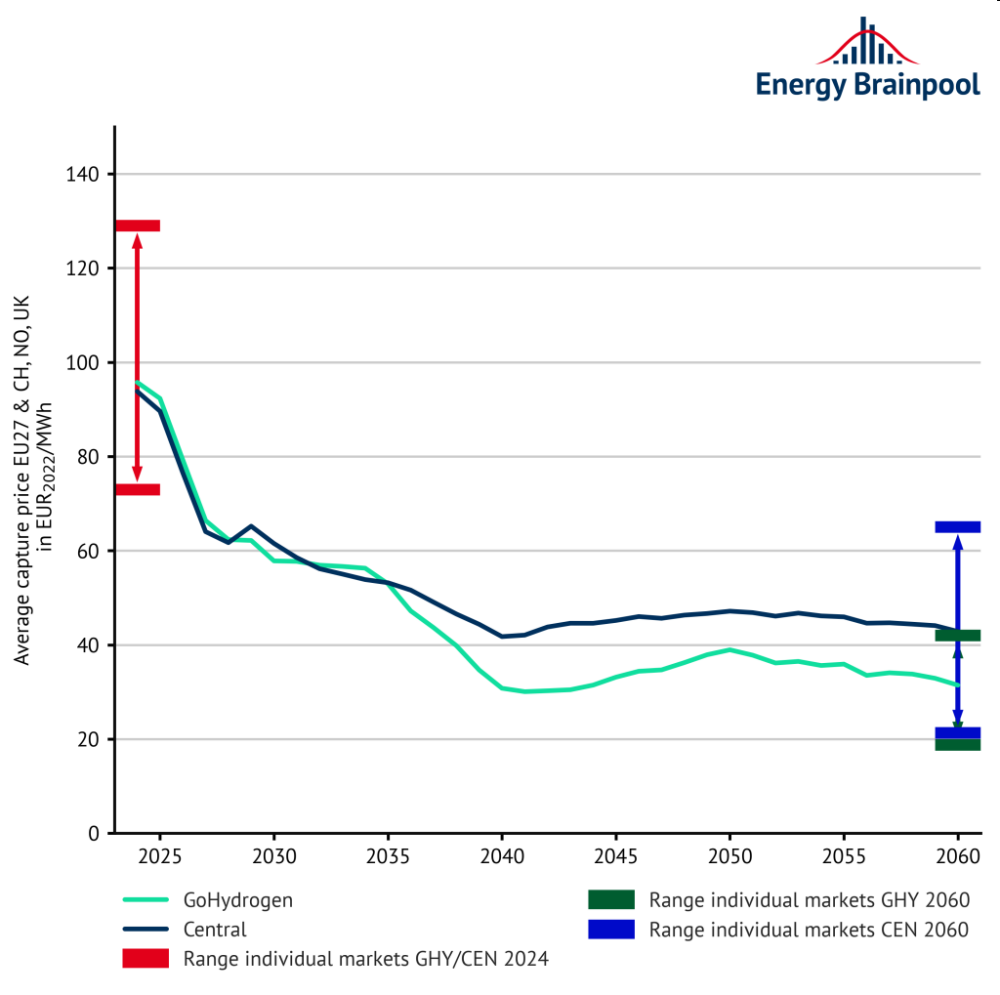
figure 13: average capture prices for solar in selected european countries
the wide fluctuation range of solar sales values in the individual countries shows how much the revenue opportunities vary. however, it should be noted that high revenues are possible in a sunny country even with low sales values. this is because the plants are less curtailed and therefore more effectively utilised.
increase in price volatility in detail
in the “central” scenario, many factors lead to a significant increase in price volatility. figure 14 shows the price volatility using box plots. specifically, they describe the annual baseload prices and the quantiles of the hourly prices in the respective year.
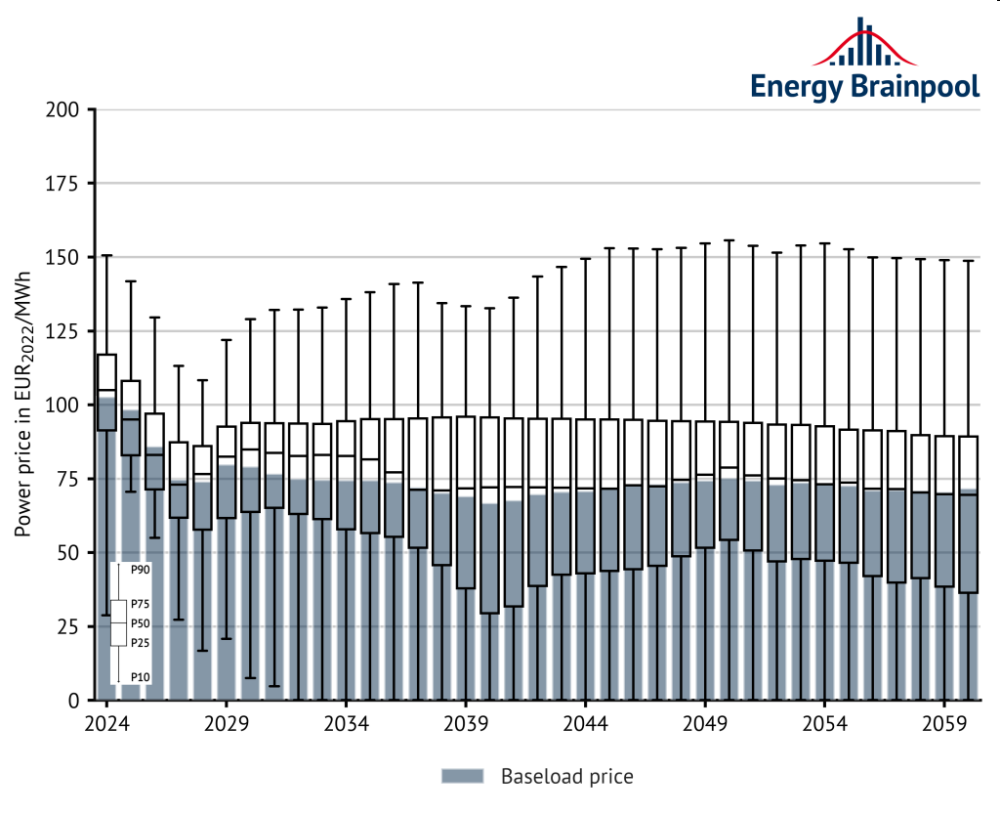
figure 14: development of demand-weighted baseload prices and quantiles of hourly prices of selected eu countries in the “central” scenario
due to the phase-out of coal-fired power and the increased expansion of renewables, pricing setting in the merit order will become increasingly binary – either the dispatchable h2-capable gas-fired power plants will determine prices in times of high electricity demand or the variable renewable power plants in times of low electricity demand. as a result, extreme prices occur more frequently and become a normal part of the power price structure of the day-ahead market. this increases the revenue potential for storage systems, and battery storage systems in particular are becoming more and more economically attractive. the fluctuations occur more frequently and to a greater extent in the “gohydrogen” scenario than in the “central” scenario.
